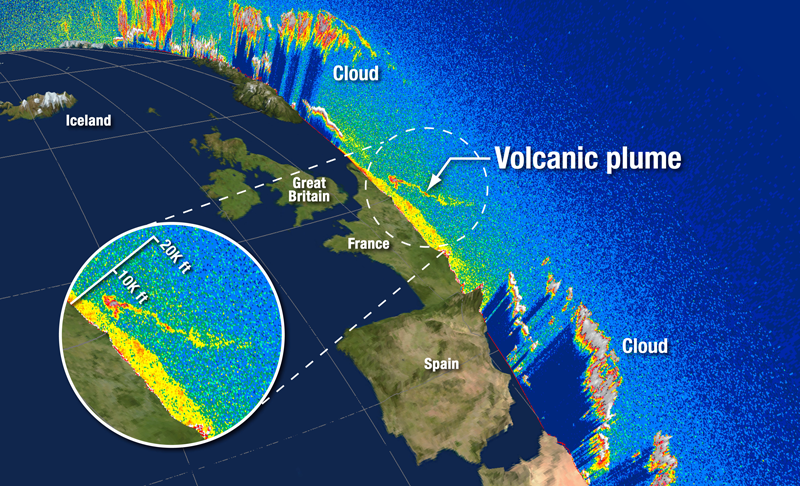
NASA’s Cloud-Aerosol Lidar and Infrared Pathfinder Satellite Observations (CALIPSO) satellite watches Eyjafjallajökull’s plume drift over northern Europe. Credit: NASA/Kurt Severance and Tim Marvel.
For more information on this image visit archive: NASA Observes Ash Plume of Icelandic Volcano.
This map shows the aerosol index over the North Atlantic following the eruption of Iceland’s Eyjafjallajökull Volcano in mid-April 2010. An index of less than 0.1 (palest yellow) indicates a haze-free sky, whereas a value of 5 (reddish brown) indicates very hazy conditions. If you were on the ground when the aerosol index was close to 5, the haze would likely be thick enough to hide the Sun.
Eyjafjallajökull is located at the southeastern corner of Iceland, and the April 15 plume spread thickly from there all the way across the Atlantic. It forced most European countries to close their airspace. (Volcanic ash cannot be detected by airplanes' radars, and it can cause jet engines to fail.)
This image is based on data collected by the Ozone Monitoring Instrument (OMI) on NASA’s Aura satellite in a series of orbits on April 15, 2010.
NASA image created by Jesse Allen, using data provided courtesy of Colin Seftor, Aura OMI Science team. Caption by Rebecca Lindsey.
For more detailed information about this image please visit the Earth Observatory.
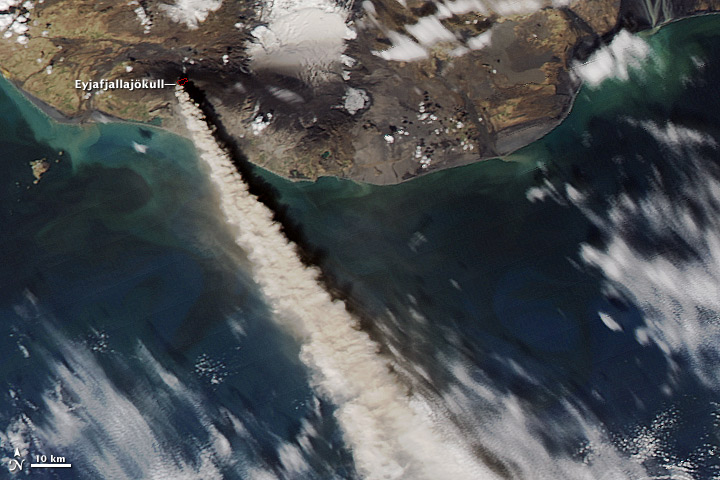
The plume of ash and steam rising from the Eyjafjallajökull Volcano reached five to six kilometers (17,000 to 20,000 feet) into the atmosphere on May 10, 2010, when the Moderate Resolution Imaging Spectroradiometer (MODIS) on NASA’s Aqua satellite captured this image. The ash is blowing southeast over the North Atlantic Ocean. Volcanic ash from previous days closed airports in Ireland and Portugal on May 10, said CNN.
NASA image by Jeff Schmaltz, MODIS Rapid Response Team at NASA GSFC. Caption by Holli Riebeek.
For more detailed information about this image please visit the Earth Observatory.
For additional observations of the eruption please visit Earth Observatory’s Eyjafjallajökull Volcano Gallery.
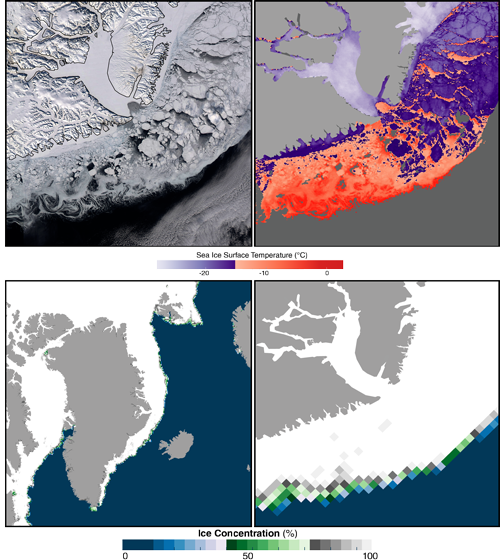
Images of East Greenland, above, show sea ice for March 27, 2010 from the Aqua satellite. A true-color MODIS image (upper left) shows glacier- and snow-covered land and individual sea ice floes in the ocean. Lower ice-surface temperature (IST) derived from MODIS (upper right) is evident near the coast (purple) where sea ice concentration is also high (AMSR-E image, lower right), with increasingly higher ISTs toward the sea ice-open water boundary where the IST shows melting and the ice concentration goes to zero. In addition, IST decreases northward and roughly in concert with increasing sea ice concentration, though not apparent in this image.
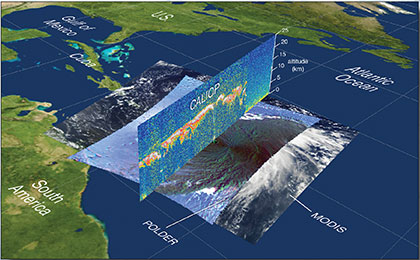
An image of Hurricane Bill as seen from the MODIS instrument (flying on Aqua) along with the cloud vertical distribution observed from the CALIOP lidar (CALIPSO) and CloudSat radar on August 19, 2009. Superimposed on the MODIS image is the polarized reflected sunlight observed by POLDER (PARASOL); the relatively dark polarization signal indicate clouds comprised of ice particles (cold, higher clouds) while the brighter scenes indicate liquid water clouds.
Merging together the diverse perspectives of the various A-Train instruments allows scientists to begin to observe the structure and dynamics of hurricanes and tropical storms in three dimensions and gives us much more information about their structure to help improve forecasts of their track and intensity.
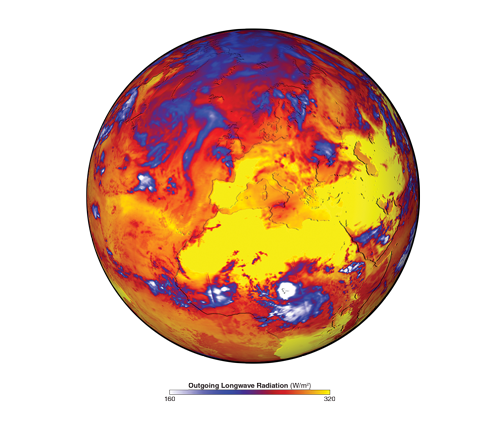
The globe below shows outgoing longwave (infrared) radiation emitted by the Earth and atmosphere during the European heatwave of 2003, as determined from the CERES instrument on Aqua. The blue-to-white colors represent very cold (high-altitude) clouds, while the yellow colors represent the warmest scenes corresponding to the largest outgoing infrared energy. The CERES calculations make use of aerosol and cloud retrievals from MODIS and therefore the radiation budget calculations are being informed by CALIPSO and CloudSat observations.
For more stories, please visit svs.gsfc.nasa.gov/Gallery/A-Train.html