
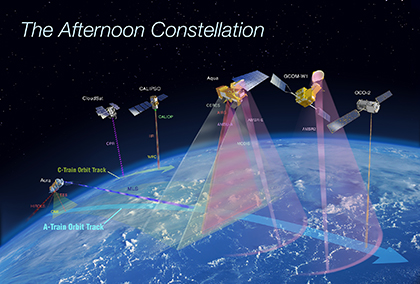
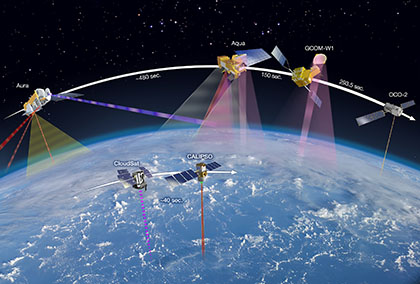
The international Afternoon Constellation includes the A-Train satellites (OCO-2, GCOM-W1, Aqua, and Aura) as well as the C-Train satellites (CALIPSO and CloudSat). The observation geometry of each constellation instrument is shown (e.g., the MODIS “swath” extends to 2330 km in a direction perpendicular to Aqua’s ground track): active instruments aboard CALIPSO (CALIOP) and CloudSat (CPR) are indicated with dashed lines. This illustration color-codes instrument swaths—the area of Earth’s surface, or the surface of its atmosphere, over which data are collected—based on observed wavelength ranges. Microwaves (observed by both AMSR instruments, AMSU-A, CPR, MLS) are represented as red-purple to deep purple colors; yellow represents solar wavelengths (OMI, OCO-2); gray represents solar and infrared wavelengths (MODIS, CERES); and red represents other infrared wavelengths (IIR, AIRS, TES, HIRDLS).
The international Afternoon Constellation includes the A-Train satellites (OCO-2, GCOM-W1, Aqua, and Aura) as well as the C-Train satellites (CALIPSO and CloudSat).
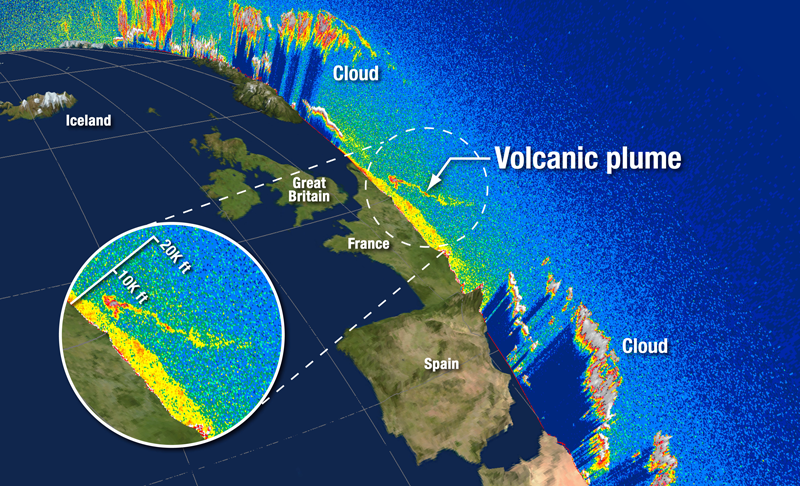
NASA’s Cloud-Aerosol Lidar and Infrared Pathfinder Satellite Observations (CALIPSO) satellite watches Eyjafjallajökull’s plume drift over northern Europe. Credit: NASA/Kurt Severance and Tim Marvel
This map shows the aerosol index over the North Atlantic following the eruption of Iceland’s Eyjafjallajökull Volcano in mid-April 2010. An index of less than 0.1 (palest yellow) indicates a haze-free sky, whereas a value of 5 (reddish brown) indicates very hazy conditions (if you were on the ground the haze would likely be thick enough to hide the sun. This image is based on data collected by the Ozone Monitoring Instrument (OMI) on NASA’s Aura satellite in a series of orbits on April 15, 2010. NASA image created by Jesse Allen, using data provided courtesy of Colin Seftor, Aura OMI Science team. Caption by Rebecca Lindsey
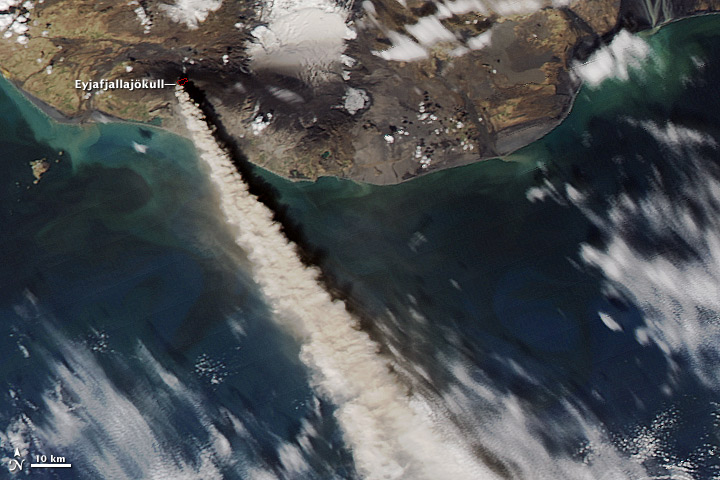
The plume of ash and steam rising from the Eyjafjallajökull Volcano reached five to six kilometers (17,000 to 20,000 feet) into the atmosphere on May 10, 2010, when the Moderate Resolution Imaging Spectroradiometer (MODIS) on NASA’s Aqua satellite captured this image. The ash is blowing southeast over the North Atlantic Ocean. Volcanic ash from previous days closed airports in Ireland and Portugal on May 10, said CNN. NASA image by Jeff Schmaltz, MODIS Rapid Response Team at NASA GSFC. Caption by Holli Riebeek.
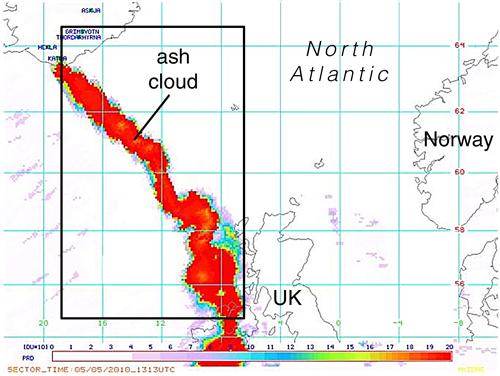
This image of Iceland’s Eyjafjallajökull volcano on May 5, 2010 from Aura satellite (OMI) observed a sulfur dioxide (SO2) plume. A plume of SO2 is an indicator of fresh volcanic ash clouds.
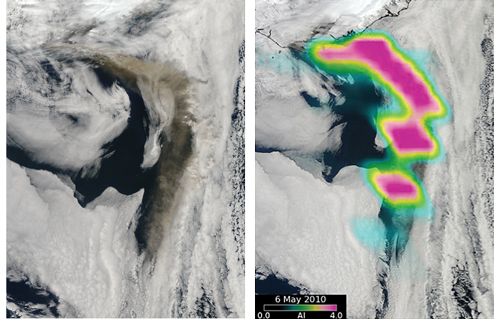
These images from Aqua/MODIS (left) and Aura/OMI (right) observed the volcano’s ash cloud on May 6, 2010.
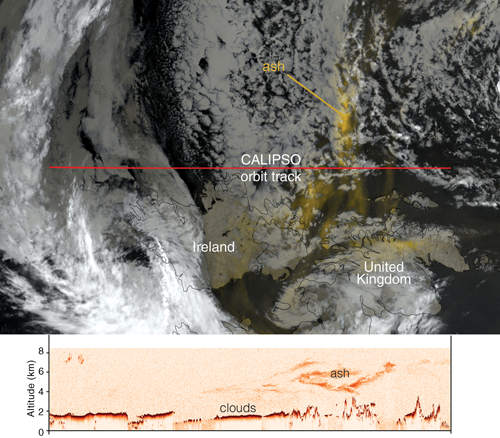
These images from Aqua/MODIS (top image) and CALIPSO/CALIOP (bottom image) shows an ash plume from Eyjafjallajökull volcano in Iceland on May 16, 2010
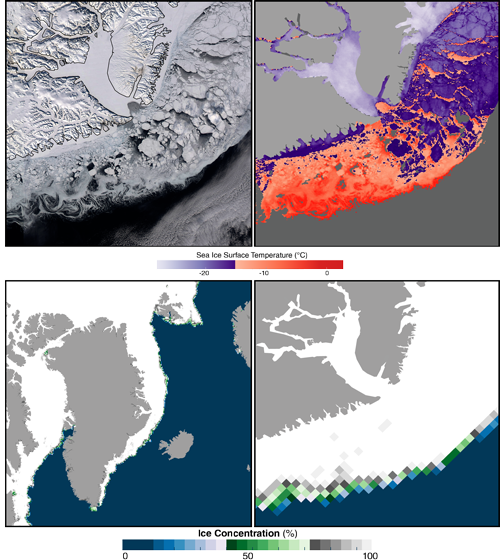
These images of East Greenland on March 27, 2010 are from Aqua. A MODIS image (upper left) shows glaciers and snow cover on land, and sea ice floes in the ocean. Ice-surface temperature (IST) derived from MODIS (upper right) increases roughly with decreasing sea ice concentration from AMSR-E (lower right) toward the ice-water boundary.
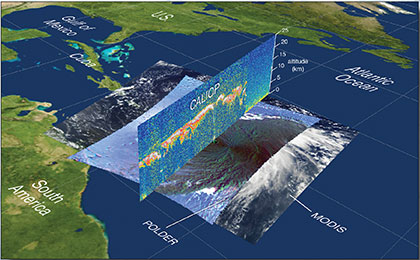
This is an image of Hurricane Bill as seen from the MODIS instrument (flying on Aqua) with cloud heights from the CALIOP lidar (CALIPSO) on August 19, 2009. Superimposed on the MODIS image is the polarized reflected sunlight observed by POLDER (PARASOL).
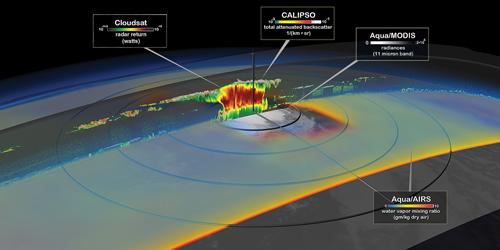
Tropical Storm Debby crossed the Central Atlantic on August 24, 2006 and was observed by four different A-Train instruments: Aqua/MODIS (in gray, center) shows an overview of the storm; Aqua/AIRS data is superimposed; and CloudSat’s radar (CPR) and CALIPSO’s lidar (CALIOP) show different slices through the storm’s center.
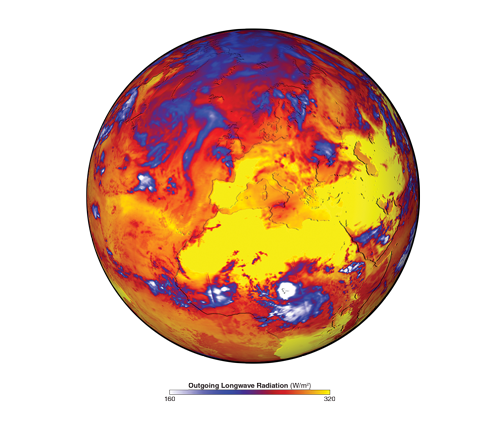
The globe below shows outgoing longwave (infrared) radiation emitted by the Earth and atmosphere during the European heatwave of 2003, as determined from the CERES instrument on Aqua. The blue-to-white colors represent very cold (high-altitude) clouds, while the yellow colors represent the warmest scenes corresponding to the largest outgoing infrared energy. The CERES calculations make use of aerosol and cloud retrievals from MODIS and therefore the radiation budget calculations are being informed by CALIPSO and CloudSat observations.
