
Having examined the roles of the individual components of the A-Train, let’s now consider the value of the entire formation. By combining all of these components in a carefully engineered formation, scientists are able to gain a better understanding of important parameters related to climate change. The A-Train formation allows for synergistic measurements—meaning that data from several different satellites can be used together to obtain comprehensive information about various key atmospheric components or processes. Combining the information from several sources gives a more complete answer to many questions than would be possible from any single satellite taken by itself. Some of the most important questions are listed below followed by information on how the information obtained by the satellites of the A-Train can be combined together to help scientists answer these questions.
 Figure 1: Afternoon Constellation Science Opportunities
What are the aerosol types and how do observations match global emission and transport models?
Aerosol height information obtained by CALIOP can be combined with data on aerosol size distribution and composition obtained by POLDER and MODIS. CALIOP also provides additional information on aerosol shape and a qualitative classification of aerosol size; data from OMI provides information on the global distribution of absorbing aerosols.
How do aerosols contribute to the Earth Radiation Budget (ERB)/climate forcing?
Data from CALIOP, POLDER, MODIS and OMI helps answer this question. In addition, data from CERES is crucial for providing information on ERB. Also, data from AIRS, HSB and AMSR-E can provide information on how aerosol climate forcing changes with atmospheric humidity. Information from these sensors can also be used in conjunction with data from CloudSat’s CPR to offer an unprecedented opportunity to understand what role aerosols play in changing cloud properties, and thus changing the ERB.
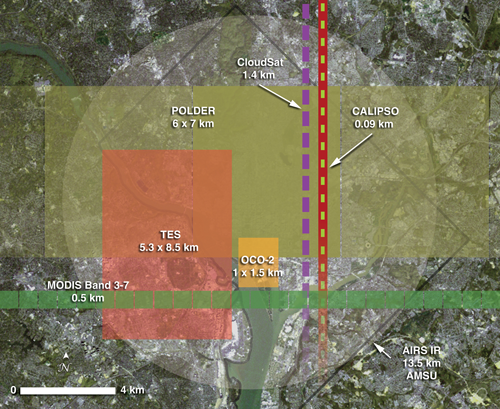 Figure 2: Individual A-Train satellite Nadir footprints
How does the A-Train collect synergistic measurements?
The image at right (Figure 2) shows the overlapping footprints of several of A-Train instruments (colors correspond to those in Figure 3) superimposed on a close-up image of Washington, DC. The purpose is to give a sense of how, over the course of an orbit, the swath of each instrument overlaps the others, allowing for the nearly simultaneous observations of the same location or event that are crucial to the science of the A-Train. This close-up perspective also brings the challenge of formation flying into sharper focus. In order to successfully overlap science measurements from different A-Train instruments, each with varying footprints and resolutions, each member of the A-Train must strictly maintain its position in the constellation.
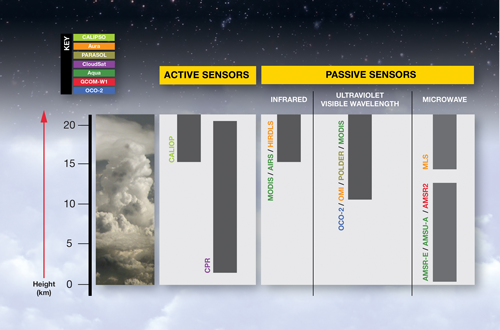 Figure 3: Vertical Resolutions of the A-Train satellites
How do the A-Train's individual satellite sensors penetrate through Earth's atmosphere?
The A-Train is equipped with a variety of passive and active remote-sensing instruments. The active sensors (i.e., CPR and CALIOP) emit "pencil-thin" pulses of energy that slice through the atmosphere, and strike a target. The return pulse of energy is analyzed to produce a very high-resolution view of a very small area. The passive sensors don't emit energy; they "see" reflected sunlight in the visible and ultraviolet wavelengths, and heat (infrared) that is both reflected and emitted from Earth's atmosphere and surface. They provide wider, more global coverage, allowing for snapshots of different layers of the atmosphere.
Each instrument detects certain wavelengths of infrared, visible, ultraviolet, or microwave energy. It turns out that each of these types of radiation offers strengths and weaknesses when it comes to observing the atmosphere. Infrared (IR) sensors detect the heat released from whatever "surface" they observe, but can't penetrate thick cloud layers. Ultraviolet and visible sensors (e.g., MODIS) are able to probe deeper into clouds than IR sensors, but not all the way to the surface. Microwave sensors (e.g., AMSR/AMSU) can "see" the whole atmosphere-even when it's cloudy. Figure 3 shows the vertical resolutions of the A-Train's passive and active sensors.